Archive for the ‘ musings ’ Category

More reasons why I teach

This is my fuel. This is why I teach. Sure, I won’t please everyone. Not everyone will appreciate or will be happy with the way I teach, but even if there’s one person in the class who thinks the time they spent in my class was worth it – that’s all the reason I need.

(All names removed from cards below)

See full blog post at sqlbelle.com

VN:F [1.9.22_1171]
Rating: 10.0/10 (1 vote cast)
VN:F [1.9.22_1171]
Rating: +1 (from 1 vote)

#Windows10 and Visual Studio 2015 #VS2015 Jumpstart and Resources

Windows 10 and Visual Studio 2015 have been released.

Microsoft claims Windows 10 as the best OS yet and Visual Studio 2015 has been enriched with ability to work on desktop, mobile (Windows, Android, and iOS), web and cloud applications and services. (It’s pretty sweet that there is a free Visual Studio Community version too!)

Here are some resources you’ll need to get started (including tools, online courses).

VN:F [1.9.22_1171]
Rating: 10.0/10 (1 vote cast)
VN:F [1.9.22_1171]
Rating: 0 (from 0 votes)

Discovering SSRS Report Parameters using PowerShell

We can use PowerShell to discover many SSRS properties, including the different parameters available in a report. This blog post is based on SQL Server 2014 and PowerShell V5.

The example report utilizes different variations of parameters. In the example, Customer ID is an integer. Order Date From and To are dates. Online Flag is a boolean. Min Total Due is a float. Status is a multi-value text.

Additional properties can be found in the Report Parameter window, including whether the parameter is nullable, if it’s multivalued, or if it’s visible or hidden, etc.

To do this in PowerShell, the first thing to do is to add the assembly that will allow us to create the ReportViewer object. Note that the version and public key token are specified, so check the version you have on your machine to ensure the accuracy.

See full blog post here

VN:F [1.9.22_1171]
Rating: 10.0/10 (1 vote cast)
VN:F [1.9.22_1171]
Rating: 0 (from 0 votes)

sqlbelle.com

It’s time for a change. I will be posting new blogs over at http://sqlbelle.com

VN:F [1.9.22_1171]
Rating: 9.0/10 (3 votes cast)
VN:F [1.9.22_1171]
Rating: 0 (from 0 votes)

PASS then, PASS now. Getting ready for #Summit14

It’s PASS Summit time again! #Summit14 is happening in Seattle, WA – November 3-7, 2014 at the Washington State Convention and Trade Center.

I still remember the first time I attended PASS (started with a pre-con from Brian Knight no less )…

I was wide-eyed, starstruck. Who would have thought that attending a technical conference would feel like attending your first rock concert ever? That’s what I felt like. I was meeting and talking to people who have authored books, articles, blog posts. I remember going up to a few of them, their authored books in hand, asking for their autographs :)

At the time, tweeting wasn’t really a big thing yet. But I did see the bloggers table (more like watched in amazement), where a lot of the rockstars blogged their way through the keynote. I would refresh my browser every so often and check who has already posted a new entry for the day (or morning). A lot of them also summarized sessions, Day 1 adventures, Day 2 adventures, #sqlkaraoke etc.

The first couple years I attended PASS, I admit I was quite intimidated and shy, and would resort to a corner whenever I got the chance. Although through the years I was able to muster up some courage to talk to some of the rockstar bloggers and meet a few more folks. You know what I discovered, a lot of them are really nice. And no they don’t bite.

It might have been the second or third year of me attending the PASS Summit when live tweeting became popular. My phone battery always drained like crazy, so I had to switch between phone and laptop to keep up with the tweets. This was a fun time. I got to “meet” more people through the tweets. And before long, I did meet a lot of them in person. It was hard not call them by their twitter handles at first though. I still remember calling Jorge Sergarra @sqlchicken in person the first time I met him at PASS.

Aahh, time flies. Attending PASS for me this year, I’m sure, will still feel like the first time I attended PASS. I will still feel giddy, and nervous, and shy. But all it takes is that first chat with #sqlfamily …

My advice to anyone attending PASS for the first time?
Just enjoy it.
Go and say hi. Muster up that courage and say hi to one of the SQL Rockstars you look up to. Go and say hi to a fellow SQL Server professional at the breakfast/lunch table.
Pat yourself on the back. You made a good decision attending PASS. It could be the start of something good, something better. No I am not saying what you have right now or where you are right now is not good. Not at all. All I am saying is, there is a lot to gain by meeting the #sqlcommunity.
If and when you can, attend a pre-con. I enjoy attending the pre-cons when I get the chance. You learn a LOT. Your brain will be so full, and the conference hasn’t even started yet.
If and when you can, get those conference recordings. It’s a good investment. I knew there were too many good sessions, and I just can’t physically attend all of them. So I have tried to get the PASS recordings whenever I can. It’s like my Netflix of SQL Server stuff. At night, I can just load up my laptop with a session, watch one, or half, or two, before I head to bed.
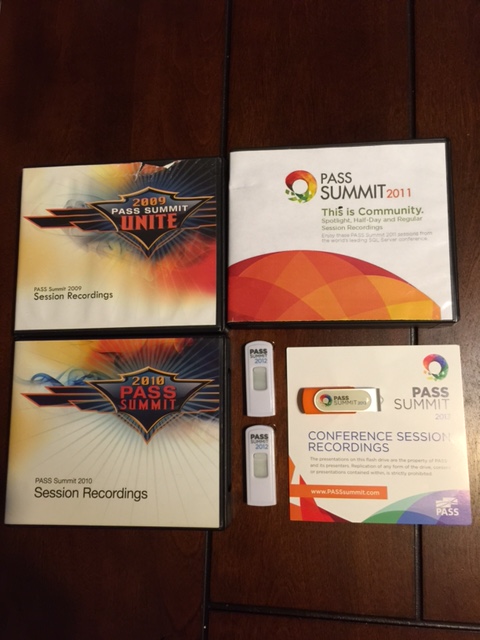
PASS Summit Conference Recordings

A few more weeks. I can’t wait. The SQL Server community (#sqlfamily hash tag in twitterverse) is an amazing community. I can’t wait to join them again in #Summit14. I have no doubt, it will feel like the first time.

VN:F [1.9.22_1171]
Rating: 0.0/10 (0 votes cast)
VN:F [1.9.22_1171]
Rating: 0 (from 0 votes)

Downloading Vancouver Weather Data Using PowerShell

I’m trying to get some data I can play around with Tableau, fortunately information for Canadian climate data is available in CSV and XML from http://www.climate.weatheroffice.gc.ca/. I thought I’d go fetch the Vancouver daily weather data since 1953 using PowerShell.

Here’s a few PowerShell snippets for anyone interested. I haven’t cleaned these up yet, but should be pretty functional.

Script to Fetch Data

$yearfrom = 1953
$yearto = 2012
$folder = "C:TempWeather Files"
for ($i = $yearfrom; $i -le $yearto; $i++)
{
   $filename = "weather_$($i).csv"
   $weatherfile = Join-Path $folder $filename
   $url = "http://www.climate.weatheroffice.gc.ca/climateData/bulkdata_e.html?Prov=BC&StationID=889&Year=$($i)&Month=1&Day=1&timeframe=2&format=csv"
   $webclient = New-Object System.Net.WebClient
   $webclient.UseDefaultCredentials = $true
   $webclient.DownloadFile($url, $weatherfile)
}

Script to Remove Extra Lines

$path = "C:TempWeather Files*.*"
$newfolder = "C:TempWeather FilesClean"
 
Get-ChildItem -Path $path -Include "*.csv" |
Foreach {
   #need to delete lines 1-25, leave only data
   $file = $_
   $newfilename =  "clean_$($file.Name)"   
   $newfile = Join-Path $newfolder $newfilename
   $filecontents = Get-Content $file.FullName   
   $filecontents[25..($filecontents.length-1)] | Out-File $newfile -Encoding ascii
}

Script to Merge Files

$csvfolder = "C:TempWeather FilesClean"
$mergefolder = "C:TempWeather FilesMerge"
$mergedfilename = "merged_all_weather.csv"
$header = @"
"Date/Time","Year","Month","Day","Data Quality","Max Temp","Max Temp Flag","Min Temp","Min Temp Flag","Mean Temp","Mean Temp Flag","Heat Deg Days","Heat Deg Days Flag","Cool Deg Days","Cool Deg Days Flag","Total Rain (mm)","Total Rain Flag","Total Snow (cm)","Total Snow Flag","Total Precip (mm)","Total Precip Flag","Snow on Grnd (cm)","Snow on Grnd Flag","Dir of Max Gust (10s deg)","Dir of Max Gust Flag","Spd of Max Gust (km/h)","Spd of Max Gust Flag"
"@
 
#put headers in final merged file
$header | Out-File $fullmergedfilename
$fullmergedfilename = Join-Path $mergefolder $mergedfilename
 
Get-ChildItem -Path $csvfolder | 
Get-Content |
Out-File $fullmergedfilename -Append
 
#open up windows explorer, let's check
explorer $mergefolder
VN:F [1.9.22_1171]
Rating: 10.0/10 (5 votes cast)
VN:F [1.9.22_1171]
Rating: 0 (from 0 votes)

The company I work for is evaluating tools for BI/Visualization, and Tableau is one of the front runners that we are considering.

I’ve been fortunate to be able to attend this week’s Advanced Tableau training in Vancouver. Our trainer is one of the Tableau Jedis, Interworks’ Director of Business Intelligence (BI) Dan Murray, and boy does he know how to impress.

At first, because of budget constraints, I was contemplating on whether I should just watch the videos – since Tableau has graciously published a number of them allowing anyone to learn the product. But I’ve always thought that there’s always something to learn from in class training – especially if you get an awesome instructor. And I am fortunate – and very thankful – I did get an awesome instructor. I cannot believe how much he packed in two (2) days of training. Don’t get me wrong, my brain was full after two days – but even after the class ended I just wanted to keep on going and try out more Tableau stuff.

I won’t go through each topic that we covered, but for anyone interested, the curriculum for the Advanced Tableau training is posted in the Tableau site. Upcoming training sessions from Interworks are posted in the Interworks site.

Anyway, just wanted to share some of the tidbits I have learned:

Tableau Specific

  • Extracts allow you to work with your data really fast.
    • True story – in v6 an 80M record Tableau extract took > 30 mins to load. In v7, it took ~ 1 second.
  • The color of the pill matters. BLUE means discrete. GREEN means continuous.

  • Tableau can do inner, left, right join, or union, although Tableau usually doesn’t recommend unions, they don’t guarantee performance
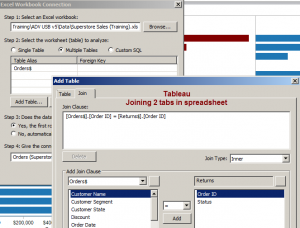
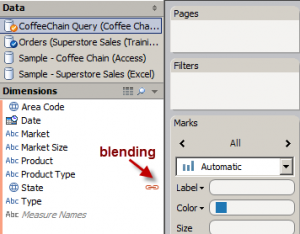
  • Tableau works great with relational data, even flat files. Within the same connection, you can do JOINs on your tables, but within different connections you can BLEND. JOINs happen at the server (or source), BLENDs happen locally.

    Tableau JOIN

    Tableau BLEND

  • Ctrl + Dragging a pill allows you to copy the pill and repurpose
  • Actions are almost always faster than parameters
  • Quick filters are great, but use sparingly. When dashboarding, real estate is expensive (sounds like the Vancouver real estate market)
  • When adding reference lines, invoke reference line from axis you want to reference from
  • Annotations can be risky – might fly around when your data changes
  • Tableau tooltips look awesome by default.

Data Exploration and Visualization

  • Easy is hard. There’s a lot of work in making something easy.
  • Don’t be afraid to explore your data. Sometimes, you know which questions to ask, but sometimes you don’t. In either case, don’t be afraid to experiment, explore. You might be surprised at what you can discover.
  • Dan differentiates data into 3 Types:
    • Type 1 – Data you know (normal BI) – ex sales, profit etc
    • Type 2 – Data that comes from Type 1, is the blip, is the explanation to the question.
    • Type 3 – Data you needed to know that you didn’t know you needed to know; Real data discovery; Can usually be explored with scatter plots; This is where jaw dropping starts
  • Scatter plots are a great way to explore data.
  • If you’re serious about visualization, you’ll read Stephen Few’s books  and watch Hans Rosling TED talks. Also check out Deiter Rams and Iain McGilchrist‘s The Divided Brain on Youtube
  • When dashboarding – always ask yourself the question – what story am I trying to tell?

I am pretty excited to start working with Tableau. I plan to do more Tableau-related posts and tutorials in the future (of course incorporating all the tricks I’ve learned from this training session).

I work with SSRS a lot, and I can see how SSRS and Tableau can be great complements.

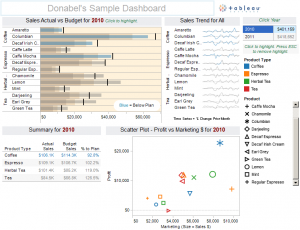
As a last bit, here’s my super awesome dashboard – done in 40 minutes and uploaded to Tableau public! (with lots of help from Tableau Jedi Dan Murray)

Go ahead, click on the image to play with it. Go ahead, I know you want to. :)

VN:F [1.9.22_1171]
Rating: 10.0/10 (7 votes cast)
VN:F [1.9.22_1171]

Rating: +2 (from 2 votes)

Get SQL Server 2012 SSRS Report Rendering Extensions Using PowerShell

There are new rendering extensions supported in SSRS 2012. Welcome extensions are the OPENXML rendering formats, to be used with Word 2007/2010 (.docx) and Excel 2007/2010 (.xlsx).

To list the rendering extensions, you can use the ReportViewer from the Reporting Services Redistributable Package.
You can download from here
http://www.microsoft.com/en-us/download/details.aspx?id=6442

 
[System.Reflection.Assembly]::Load("Microsoft.ReportViewer.WinForms, Version=11.0.0.0, Culture=neutral, PublicKeyToken=89845dcd8080cc91") | Out-Null
 
$ReportServer = "http://KERRIGAN:80/ReportServer"
$rv = New-Object Microsoft.Reporting.WinForms.ReportViewer
$rv.ProcessingMode = "Remote"
$rv.ServerReport.ReportServerUrl = $ReportServer
$rv.ServerReport.ListRenderingExtensions()

This should list all the currently supported extensions. In SSRS 2012 they are listed below. Note that both Word 2003 and Excel 2003 are technically still supported, but by default they are hidden from the export dropdown. The Excel and Word that we see in the export dropdown is the EXCELOPENXML and WORDOPENXML formats, which corresponds to the new .xlsx and .docx extensions.

Name LocalizedName Visible
XML XML file with report data True
NULL NullRenderer False
CSV CSV (comma delimited) True
ATOM Data Feed False
PDF PDF True
RGDI Remote GDI+ file False
HTML4.0
MHTML MHTML (web archive) True
EXCEL Excel 2003 False
EXCELOPENXML Excel True
RPL RPL Renderer True
IMAGE TIFF File True
WORD Word 2003 False
WORDOPENXML Word True
VN:F [1.9.22_1171]
Rating: 8.9/10 (15 votes cast)
VN:F [1.9.22_1171]
Rating: +3 (from 3 votes)
`