Archive for the ‘ SQL Server BI ’ Category

This blog post is tested on SQL Server 2014 and PowerShell V5.

PowerShell has become more feature-rich in every version. We are now looking at PowerShell V5 (currently can be downloaded as part of Windows Management Framework v5 April 2015 Preview).

The support landscape with SQL Server hasn’t changed much. There isn’t a drastic increase in SQL Server cmdlets. However, the language and feature improvements in PowerShell in general improve how we can work with SQL Server.

One area where we can use PowerShell is with SQL Server Reporting Services (SSRS). I blogged about this a while back, but it’s time to revisit and expand on how we can use PowerShell to automate report generation.

In this blog post I will focus on generating PDF reports via scripting. Let’s tackle this piece by piece first, and we’ll put everything in a nice little script at the end of the post.

First, we need to add the ReportViewer assembly to the script. For this I am using the WinForms report viewer assembly. There is similar report viewer assembly for web forms.

See full article

VN:F [1.9.22_1171]
Rating: 10.0/10 (3 votes cast)
VN:F [1.9.22_1171]
Rating: +1 (from 1 vote)

Discovering SSRS Report Parameters using PowerShell

We can use PowerShell to discover many SSRS properties, including the different parameters available in a report. This blog post is based on SQL Server 2014 and PowerShell V5.

The example report utilizes different variations of parameters. In the example, Customer ID is an integer. Order Date From and To are dates. Online Flag is a boolean. Min Total Due is a float. Status is a multi-value text.

Additional properties can be found in the Report Parameter window, including whether the parameter is nullable, if it’s multivalued, or if it’s visible or hidden, etc.

To do this in PowerShell, the first thing to do is to add the assembly that will allow us to create the ReportViewer object. Note that the version and public key token are specified, so check the version you have on your machine to ensure the accuracy.

See full blog post here

VN:F [1.9.22_1171]
Rating: 10.0/10 (1 vote cast)
VN:F [1.9.22_1171]
Rating: 0 (from 0 votes)

SQL Server 2012 – BI Semantic Model, Multidimensional vs Tabular

The landscape of Business Intelligence changes with SQL Server 2012. Microsoft has introduced a new “model” – the BI Semantic Model.
Don’t get too hung up on this word though, the BI Semantic Model is really just an umbrella terminology that says as long as a source follows the BI Semantic Model, it will be supported in the tools. This is the eventual goal anyway; for now there is still a discrepancy which tools support what.

The multidimensional model is the traditional OLAP model. Data source is a cube, that is processed from a data warehouse that usually follows a star schema. Complex calculations and queries using MDX can be done against it. It also allows write-backs.

The new tabular model is not really a “new model” because it is a relational model. Yes the same model we’ve grown accustomed to using when we query our transactional OLTP databases. The difference is, SSAS Tabular is an in-memory database. This is fueled by the xVelocity engine (previously known as Vertipaq), and it also leverages columnstore indexes. All calculations are in memory, and this makes tabular models really fast.

From a UI perspective, if you’re curious, this is what the SSAS engines look like. Notice how the node icons are different:

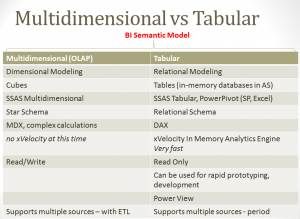
Here’s a small comparison of Multidimensional vs Tabular:

Fun times ahead!

Additional Resources:
Dustin Ryan’s Creating your First Tabular Model
Simran Jindal’s What is the Business Intelligence Semantic Model Really?
Joshua Fennessy’s MultiDimensional or Tabular – Which Model to Use?

VN:F [1.9.22_1171]
Rating: 0.0/10 (0 votes cast)
VN:F [1.9.22_1171]
Rating: 0 (from 0 votes)

SQL Server 2012 x-Terms

Just finishing up my presentation for this Saturday’s Vancouver Techfest, and was putting a slide for some of the x-terms in SQL Server 2012. Just thought I’d share it:

xVelocity In Memory Analytics Engine

In SQL Server 2008 R2 – this was introduced as Vertipaq for PowerPivot for Excel (see James Beresford blog about Vertipaq)
In SQL Server 2012 this technology was integrated into Analysis Services.
In SQL Server 2012, it was also rebranded into xVelocity. The reasoning is that this is going to become part of a bigger xVelocity family for next generation performance improvements. Simran Jindal has a great diagram that illustrates this family. Thanks Simran, very helpful!

A one liner summary of xVelocity?

This is SQL Server going fast – sometimes really really fast (think 100X faster)!

MDX

– Multidimensional Expressions
– Calculation and Query Language for multidimensional cubes
– Check out additional examples from Chris Webb’s blog or the MSDN MDX Reference

DAX

– Data Analysis Expressions
– Calculation language for PowerPivot and SSAS Tabular (for now)
– Designed to “feel familiar” to those who know Excel formulas and functions
– Check out some common DAX expressions from BIDN.com, or the DAX Technet Wiki Article, or the MSDN DAX Online Function Reference

VN:F [1.9.22_1171]
Rating: 0.0/10 (0 votes cast)
VN:F [1.9.22_1171]
Rating: 0 (from 0 votes)
`