The company I work for is evaluating tools for BI/Visualization, and Tableau is one of the front runners that we are considering.
I’ve been fortunate to be able to attend this week’s Advanced Tableau training in Vancouver. Our trainer is one of the Tableau Jedis, Interworks’ Director of Business Intelligence (BI) Dan Murray, and boy does he know how to impress.
At first, because of budget constraints, I was contemplating on whether I should just watch the videos – since Tableau has graciously published a number of them allowing anyone to learn the product. But I’ve always thought that there’s always something to learn from in class training – especially if you get an awesome instructor. And I am fortunate – and very thankful – I did get an awesome instructor. I cannot believe how much he packed in two (2) days of training. Don’t get me wrong, my brain was full after two days – but even after the class ended I just wanted to keep on going and try out more Tableau stuff.
I won’t go through each topic that we covered, but for anyone interested, the curriculum for the Advanced Tableau training is posted in the Tableau site. Upcoming training sessions from Interworks are posted in the Interworks site.
Anyway, just wanted to share some of the tidbits I have learned:
Tableau Specific
- Extracts allow you to work with your data really fast.
-
- True story – in v6 an 80M record Tableau extract took > 30 mins to load. In v7, it took ~ 1 second.
- The color of the pill matters. BLUE means discrete. GREEN means continuous.
- Tableau can do inner, left, right join, or union, although Tableau usually doesn’t recommend unions, they don’t guarantee performance
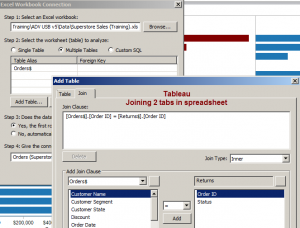
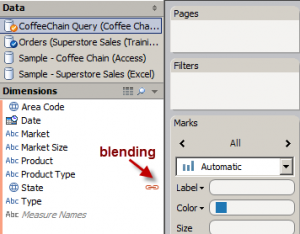
- Tableau works great with relational data, even flat files. Within the same connection, you can do JOINs on your tables, but within different connections you can BLEND. JOINs happen at the server (or source), BLENDs happen locally.
Tableau JOIN
Tableau BLEND
- Ctrl + Dragging a pill allows you to copy the pill and repurpose
- Actions are almost always faster than parameters
- Quick filters are great, but use sparingly. When dashboarding, real estate is expensive (sounds like the Vancouver real estate market)
- When adding reference lines, invoke reference line from axis you want to reference from
- Annotations can be risky – might fly around when your data changes
- Tableau tooltips look awesome by default.
Data Exploration and Visualization
- Easy is hard. There’s a lot of work in making something easy.
- Don’t be afraid to explore your data. Sometimes, you know which questions to ask, but sometimes you don’t. In either case, don’t be afraid to experiment, explore. You might be surprised at what you can discover.
- Dan differentiates data into 3 Types:
- Type 1 – Data you know (normal BI) – ex sales, profit etc
- Type 2 – Data that comes from Type 1, is the blip, is the explanation to the question.
- Type 3 – Data you needed to know that you didn’t know you needed to know; Real data discovery; Can usually be explored with scatter plots; This is where jaw dropping starts
- Scatter plots are a great way to explore data.
- If you’re serious about visualization, you’ll read Stephen Few’s books and watch Hans Rosling TED talks. Also check out Deiter Rams and Iain McGilchrist‘s The Divided Brain on Youtube
- When dashboarding – always ask yourself the question – what story am I trying to tell?
I am pretty excited to start working with Tableau. I plan to do more Tableau-related posts and tutorials in the future (of course incorporating all the tricks I’ve learned from this training session).
I work with SSRS a lot, and I can see how SSRS and Tableau can be great complements.
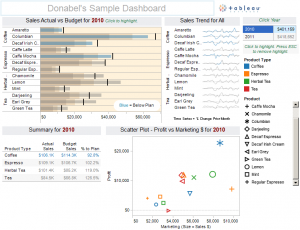
As a last bit, here’s my super awesome dashboard – done in 40 minutes and uploaded to Tableau public! (with lots of help from Tableau Jedi Dan Murray)
Go ahead, click on the image to play with it. Go ahead, I know you want to. 








Awesome! I’m so glad to see you getting in there and having fun with Tableau! btw, I agree that Tableau and SSRS are a good pair. The strong points in one compensate for week points in the other. Put them together and you can do anything!
Tim
I know for sure that Tableau is an awesome BI tool. I just wish I have an access to a full version so I can really dig to it!
me too .. right now i’ve just begged the Tableau Sales Area Manager for a trial extension. hoping my employer purchases soon so i can start digging more into it
Yeah, I think they’d be a great pair. Tableau would be awesome in the hands of the power users who know the data, and who just want to explore their data. The interactivity it gives you is awesome. It can definitely give you a story about your data that you didn’t even think about.
I am so happy you got a lot out of the class. It was a pleasure working with you this week. See you in San Diego?
It was an awesome class Dan! The pleasure is completely mine